
Fig. 3.
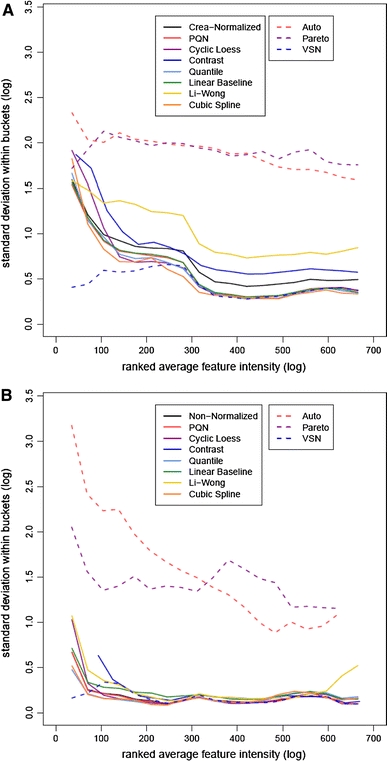
Plot of the logged standard deviation within the features versus the rank of the averaged feature intensity of the classification (a) and spike-in (b) datasets. To make the fit less sensitive to outliers, lines were computed using a running median estimator. The data is log base 2 transformed. Solid lines depict methods that are aimed at reducing sample-to-sample variations, while variable scaling and variance stabilization approaches are marked by dashed lines