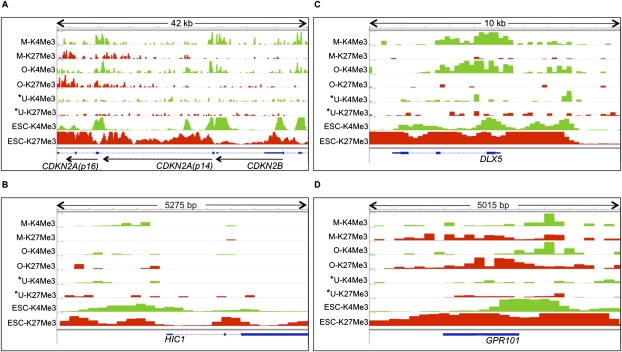
Figure 2.
Plots of H3K4Me3 and H3K27Me3 enrichment in MSCs (M-K4Me3 and M-K27Me3), osteoblasts (O-K4Me3 and O-K27Me3), U2OS (U-K4Me3 and U-K27Me3), and ESCs (ESC-K4Me3 and ESC-K27Me3). (*) Cell type in which the gene is identified as methylated. (Green and red boxes) Peak height normalized to background enrichment for H3K4Me3 and H3K27Me3, respectively. Genes represented include CDKN2A (p14), CDKN2B (p15), and CDKN2A (p16) (A), DLX5 (B), HIC1 (C), and GPR101 (D).

