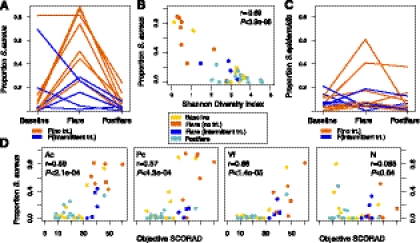
Figure 4.
Relationship between staphylococcal species and AD. (A) Longitudinal trend of mean proportion of S. aureus in AD in antecubital and popliteal creases (AcPc, n = 12) grouped by no-treatment (trt) and intermittent-trt flares. (B) Proportion of S. aureus and Shannon diversity index in AcPc. Partial correlation (adjusting for disease state, AcPc). (C) Longitudinal trend of mean proportion of S. epidermidis in AcPc. (D) Correlation of proportion of S. aureus versus objective SCORAD for each site (Ac, Pc, Volar forearm/Vf, Nares/N). Partial correlation (adjusting for disease state and site).

