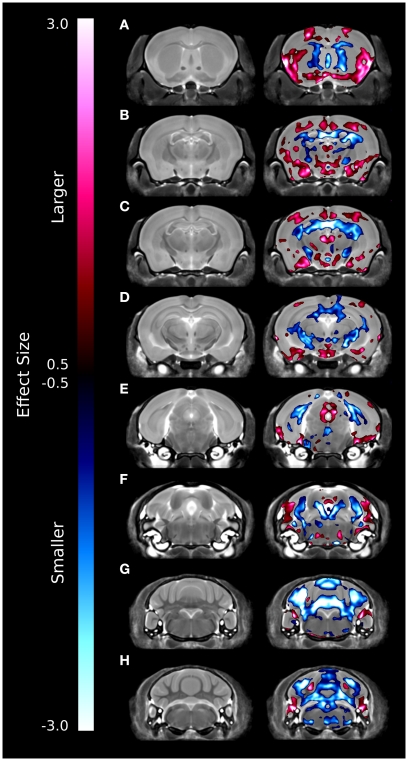
Figure 2.
Coronal slices highlighting the differences between the ITGβ3 mouse and the WT. The slices are arranged from anterior (A) to posterior (H). These maps were created by thresholding the effect size measurement by the TFCE multiple comparison correction; therefore only effects sizes of significance (TFCE corrected p value < 0.05) are displayed. Anything displayed in blue indicates a smaller volume in the ITGβ3 mouse and anything displayed in red indicates a larger volume in the ITGβ3 mouse.

