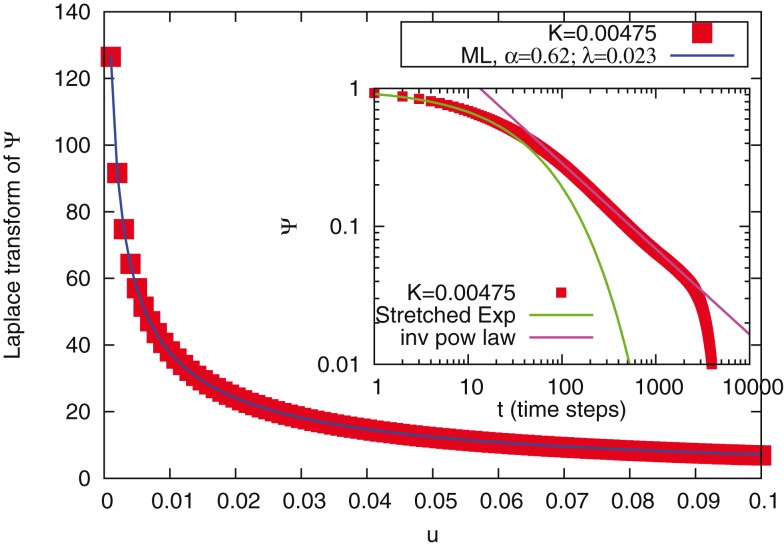
Figure 3.
Illustration of the fitting procedure adopted to prove the cooperation-induced emergence of the ML complexity. In the main figure the numerical Laplace transform of the Survival probability is plotted, for K = 0.00475 (squares). The solid line represent the fitted ML function, in the Laplace representation. The resulting fitting parameters are in this example α = 0.62 and λ = 0.023. In the insert we plot the same survival probability, but this time in the time domain. A stretched exponential exp[ − (λt)α] is superimposed in the shorter time regime, called intermediate asymptotic regime; an inverse-power law constant/tα is superimposed in the far asymptotic regime. We notice the good agreement in both the Laplace and the time representation.

