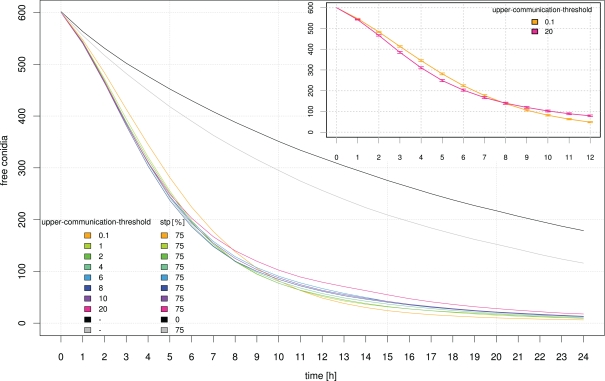
Figure 11.
Influence of the signal perception parameter “upper-communication-threshold” on the clearing efficiency dynamics. For comparison, simulation results based on random movement of neutrophilic agents (black) and STP with a 75% probability of holding direction (gray) are shown. The inset shows a zoom into the graph where a crossover of the clearing efficiency for the highest (pink) and lowest (orange) “upper-communication-threshold” occurs which can be interpreted as two opposing clearing strategies. SE are indicated.

