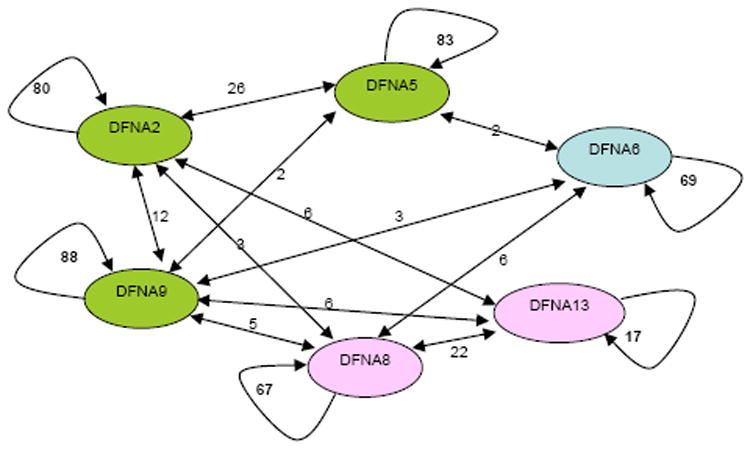
Figure 2.

Graphic depiction of the classification (and misclassification) of 2,400 audiograms from 360 patients for six genes. Each node in the graph represents a gene and each arc represents the number of individuals classified as having the audioprofile for that gene by Audiogene v2.0. The number of individuals indicated between the nodes are those misclassified by the program.
