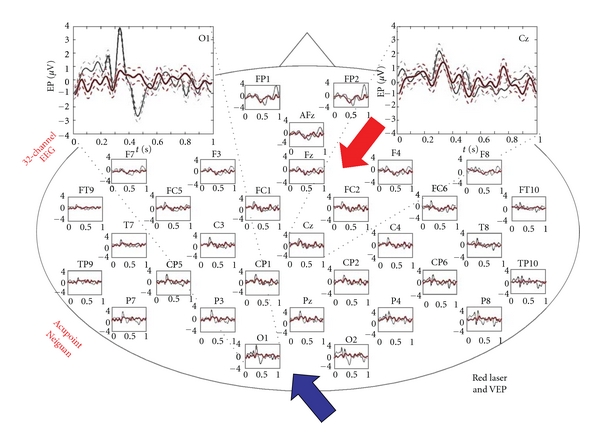
Figure 6.

Comparison of visual and laser-induced evoked potentials plotted with the same scale (X-axis: s; Y-axis: μV; mean ± SE).

Comparison of visual and laser-induced evoked potentials plotted with the same scale (X-axis: s; Y-axis: μV; mean ± SE).