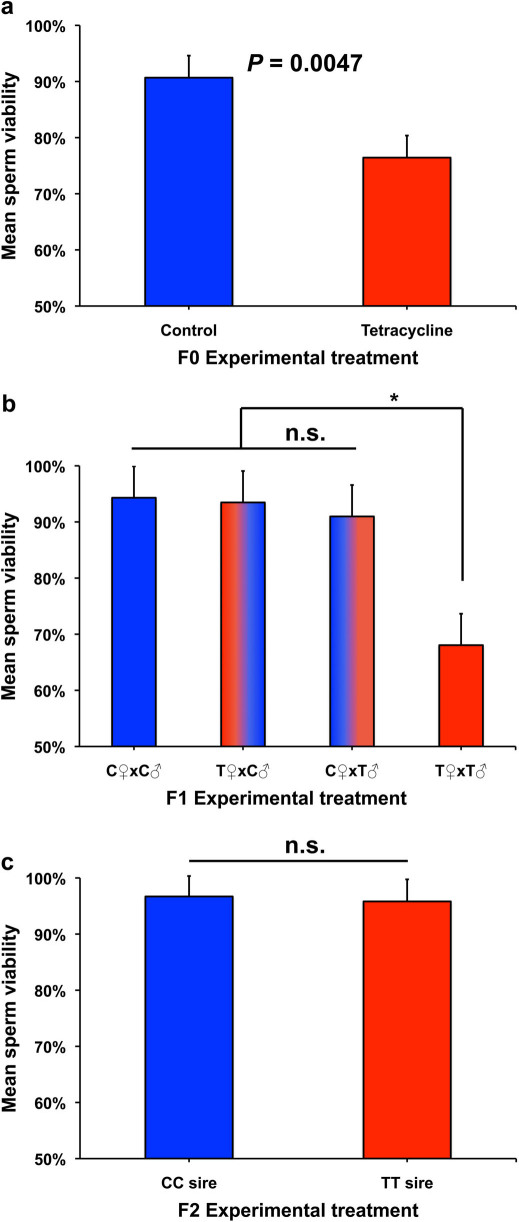
Figure 2. Tetracycline effects on sperm viability across three generations.
(a) Mean sperm viability (+ standard error) in control (C) and tetracycline-treated (T) males in the F0 (directly treated) generation. (b) Mean sperm viability in F1 untreated male offspring from the four cross types. (c) Mean sperm viability in the F2 sons of CC and TT males outcrossed to females from the laboratory population. Two-tailed P values were determined using a General Linear Mixed Model fit to a binomial response variable (proportion live sperm). In (b), multiple comparison P values were calculated using Tukey's HSD (honestly significant difference) test.

