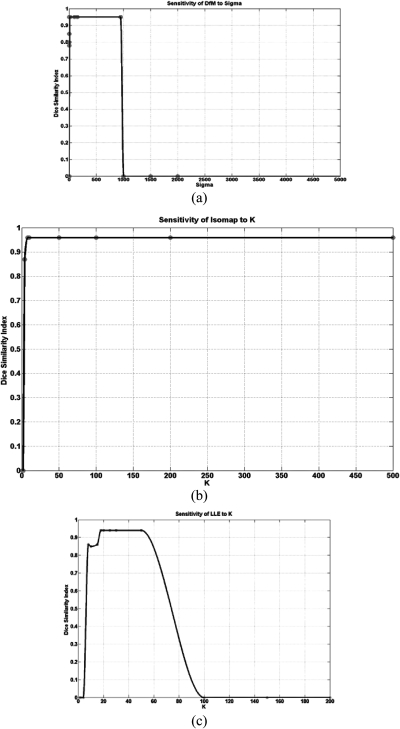
Figure 13.
Demonstration of the sensitivity of NLDR methods to control parameters: (a) effects of Sigma value on the dice similarity index between Diffusion Maps (DfM) based embedded image and the postcontrast; (b) and (c) effects of neighborhood size (K) on the dice similarity index between the embedded image and the postcontrast, respectively, for Isomap and LLE. Example input MRI data for the NLDR methods are shown in Fig. 11.

