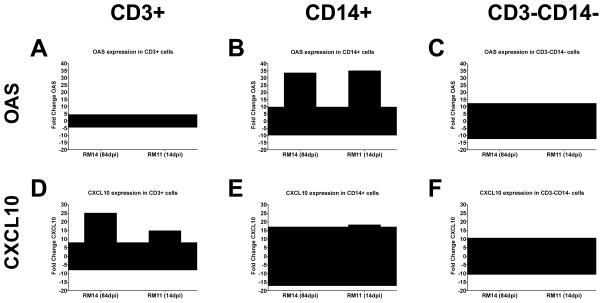
Figure 7. Expression of OAS and CXCL10 in PBMC cell subsets.
Fold changes of expression of OAS (A, B, C) and CXCL10 (D, E, F) are shown in isolated CD3+ T cells (A, D), CD14+ monocytes (B, E) and cells that do not have either of these markers (CD3−CD14−) (C, F). PBMCs were taken from macaque RM14 (84 dpi, left bar) and RM11 (14 dpi, right bar). Expression of OAS or CXCL10 in each cell subset is compared to gene expression in the same cell subset of uninfected Rhesus macaques. The fold change is considered increased or decreased in SIV infected compared to uninfected macaques when it is greater than two standard deviations (shaded area) away from the average expression in uninfected animals.

