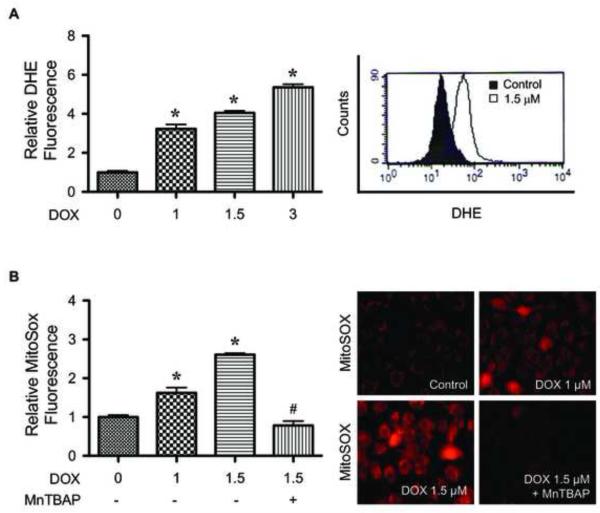
FIGURE 3.
Doxorubicin induces mitochondrial superoxide generation. A, HaCaT cells were treated with various concentrations of DOX (0-3 μM) for 2 h, after which they were analyzed for superoxide generation by flow cytometry using dihydroethidium (DHE) as a fluorescent probe. Representative flow cytometric histograms are shown in the right panel. B, cells were treated with DOX in the presence or absence of MnTBAP (50 μM) for 2 h, and analyzed for mitochondrial superoxide generation by fluorescence microscopy using MitoSOX™ Red as a probe. Representative micrographs demonstrating dose-dependent increase in mitochondrial MitoSOX™ fluorescence are shown in the right panel. Plots are mean ± S.D. (n = 3). *, p < 0.05 versus non-treated control.

