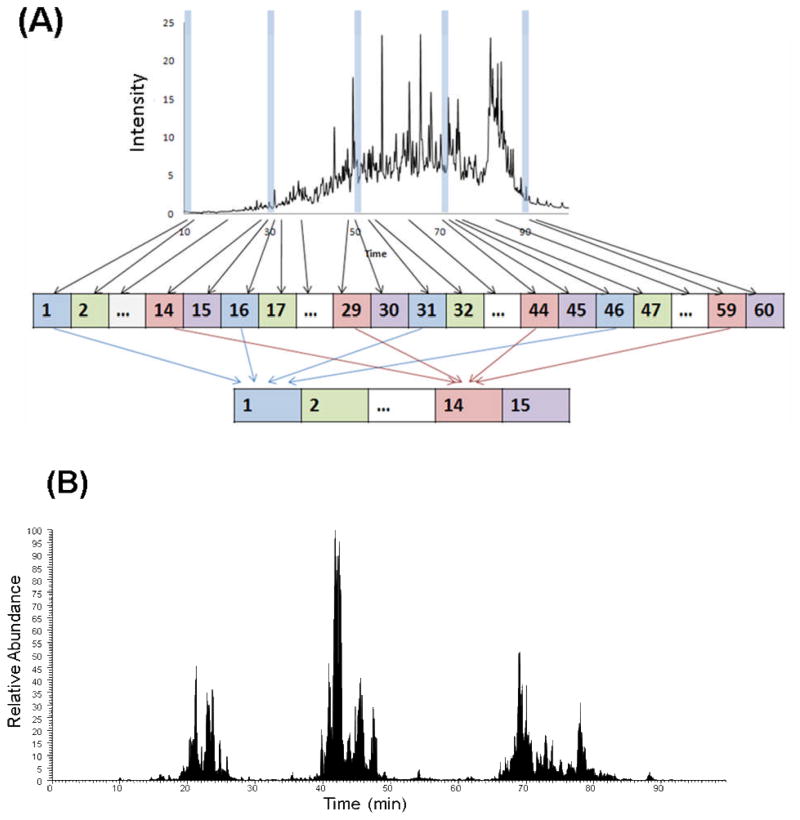
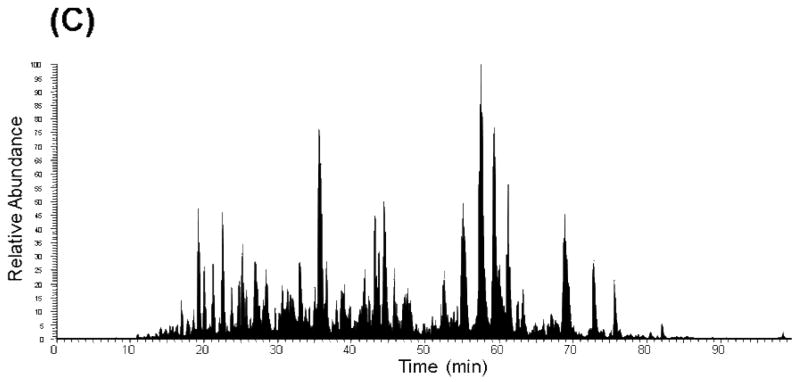
Figure 1.
A) Schematic depicting the concatenation strategy applied to a first dimensional low pH RP and high pH RP fractionation. Example RPLC-MS base peak chromatograms of fraction 10 following concatenation: B) low pH RPLC as a first dimension separation and C) high pH RPLC as a first dimension separation. Reprinted with permission from Proteomics 11:2019–2016 (2011). Copyright 2011 WILEY-VCH Verlag GmbH & Co.


