. Author manuscript; available in PMC: 2013 Jan 1.
Published in final edited form as: Bioorg Med Chem Lett. 2011 Oct 28;22(1):601–605. doi: 10.1016/j.bmcl.2011.10.074

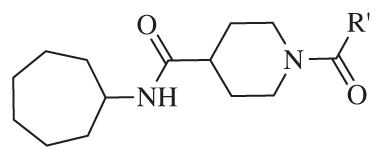
Table 2.

The biological results for amide analogs 151 to 1512

graphic file with name nihms335235u2.jpg
Compound R′ IC50a,b (nM) Compound R′ IC50 (nM)
15–1 graphic file with name nihms335235t52.jpg 1200 15–7 graphic file with name nihms335235t53.jpg 780
15–2 graphic file with name nihms335235t54.jpg 1400 15–8 graphic file with name nihms335235t55.jpg 1200
15–3 graphic file with name nihms335235t56.jpg 1200 15–9 graphic file with name nihms335235t57.jpg 200
15–4 graphic file with name nihms335235t58.jpg 630 15–10 graphic file with name nihms335235t59.jpg 1100
15–5 graphic file with name nihms335235t60.jpg 950 15–11 graphic file with name nihms335235t61.jpg 2000
15–6 graphic file with name nihms335235t62.jpg 92 15–12 graphic file with name nihms335235t63.jpg 590
a

Reported IC50 values are the average of three replicates. The fluorescent assay as performed here has a standard error between 10 and 20% suggesting that differences of twofold or greater are significant.27

b

t-AUCB that has an IC50 between 1 and 2 nM was used as positive control.13