Fig. 1.
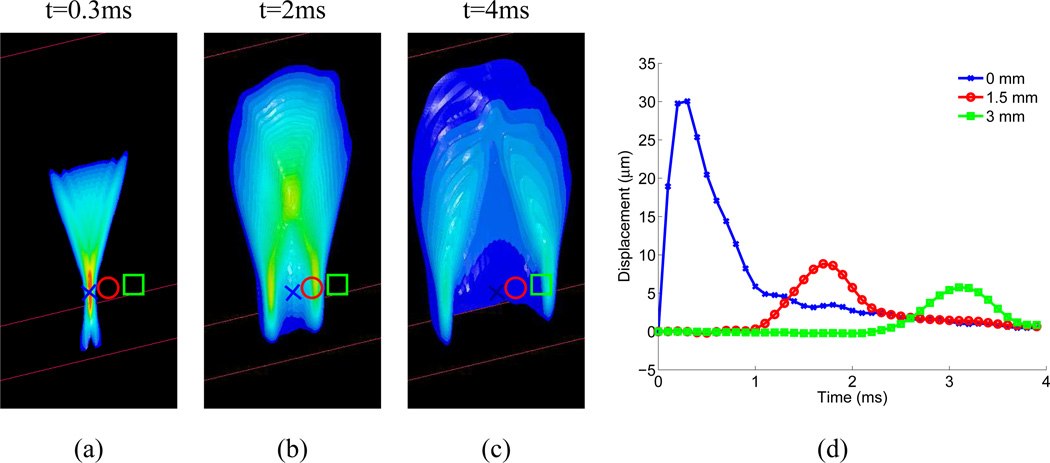
Images (a)–(c) portray the simulated axial displacement response in a 3D, homogeneous, isotropic, elastic tissue (E, the elastic Young’s modulus, = 4kPa) to a focused (F/1.3 focal configuration, frequency= 6.7 MHz), impulsive (pulse duration = 50 µs), radiation force excitation, at three snapshots in time after the excitation (0.3ms, 2 ms, and 4ms). The transducer is located at the top of the images, focused in the center of the plane, at 20 mm in depth (marked by the blue X in the images). The red circle is located at 1.5 mm laterally, and the green square at 3 mm laterally in the images. The 3D tissue volume has been bisected so that the central axial/lateral plane is visible. The displacement response at each symbol (x, circle, square) as a function of time after excitation is shown in (d). Positive displacement indicates displacement in the direction of acoustic wave propagation, or down in the images. Initially, (image (a)), the axial displacement response is spatially distributed in the geometry of the applied radiation force, confined within the ROE, with the largest displacement near the focus; the peak focal displacement of 30 µm occurs at 0.4 ms after excitation (blue line in (d)). With increasing time after excitation, a shear wave propagates away from the ROE, decreasing in amplitude with propagation distance due to geometric spreading. In viscoelastic media such as tissue, shear wave attenuation would further decrease the shear wave amplitude with increasing propagation distance. The peak displacement amplitude is inversely proportional to the tissue elastic (shear) modulus, and the speed of the shear wave propagation is quadratically related to the shear modulus.

