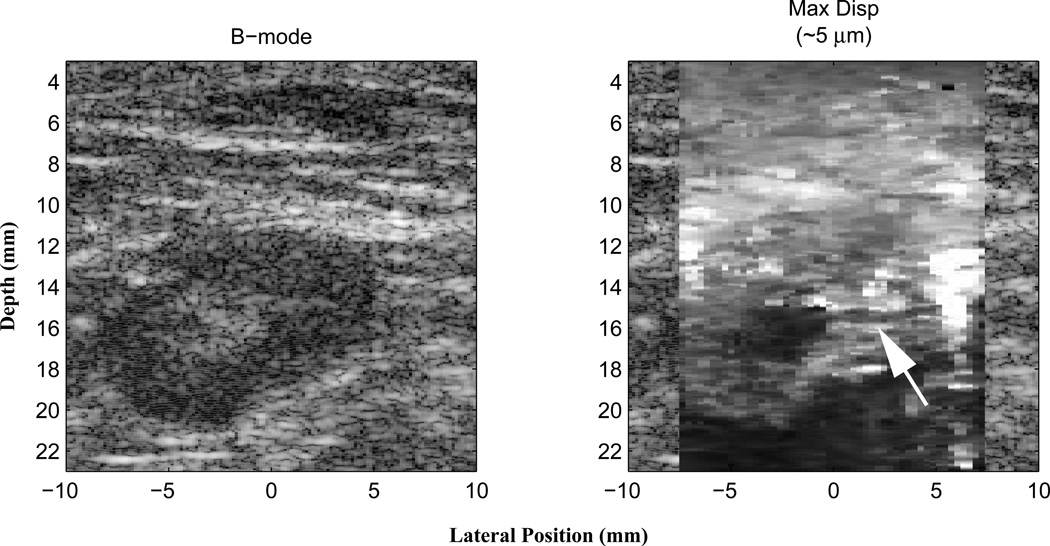
Fig. 6.
B-mode (left) and matched ARFI maximum displacement image (right) of an in vivo, biopsy-proven reactive lymph node in the breast. The lymph node is the darker oval region in the B-mode image appearing from 12–22 mm in depth. The echogenic center of the lymph node is the normal hilum that corresponds to the region of decreased displacement in the ARFI image (darker region). The node itself appears slightly stiffer (darker) than the surrounding tissue, with an efferent ductal, structure clearly visualized (arrow). These data were obtained with an Antares scanner and a VF105 linear array transducer. Figure reproduced with permission from (59)

