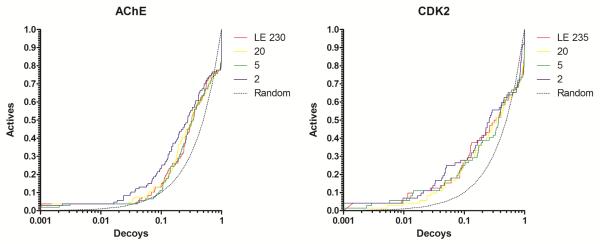
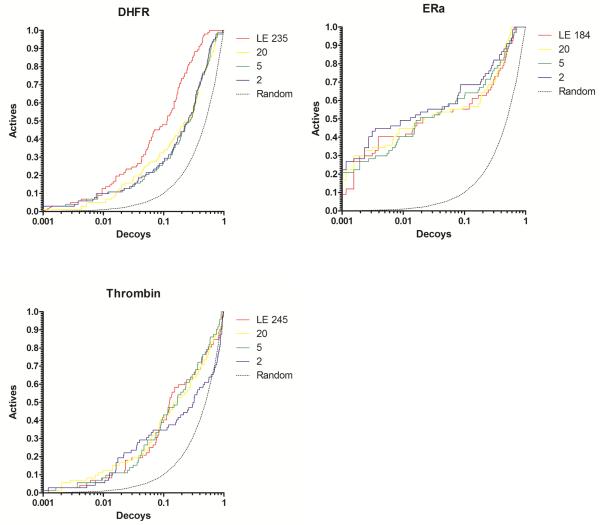
Figure 2.
Docking enrichment plots for five protein systems using DUD. The fraction of actives ranked by docking score (y-axis) is plotted against the fraction of ranked decoys (x-axis; logarithmic scale). Results docking to the full Limoc EPS (LE; red) and most diverse sub-ensembles with 20 (yellow), 5 (green), and 2 (purple) members are shown.


