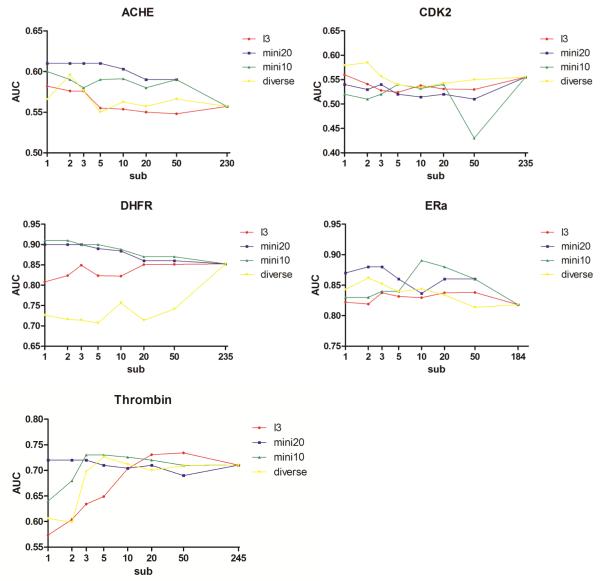
Figure 3.
AUC as a function of the number of members in the sub-ensembles of protein structures. The results for three different selection schemes are presented: Selection by diversifying the EPS using pairwise RMSD values (yellow line), by training using binding-pose reproduction of three different co-crystallized ligands (red), and by optimizing the difference in scores between a small set of known actives and decoys (using 20 actives: blue; 10 actives: green).

