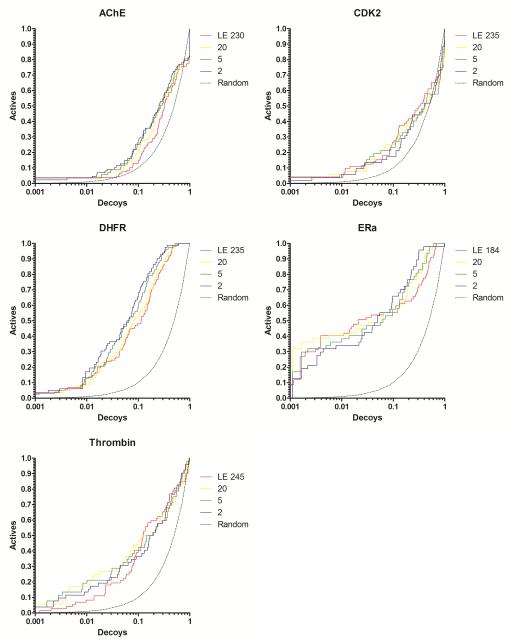
Figure 5.
Docking enrichment plots for five protein systems using DUD. The fraction of actives ranked by docking score (y-axis) is plotted against the fraction of ranked decoys (x-axis; logarithmic scale). Results docking to the full Limoc EPS (LE; red line) and sub-ensembles with 20 (yellow), 5 (green), and 2 (purple) members are shown. Members of the sub-ensembles were selected based on their potential to actives from decoys of a small sub-set of ligands from the DUD dataset. The results for using 20 actives are displayed.

