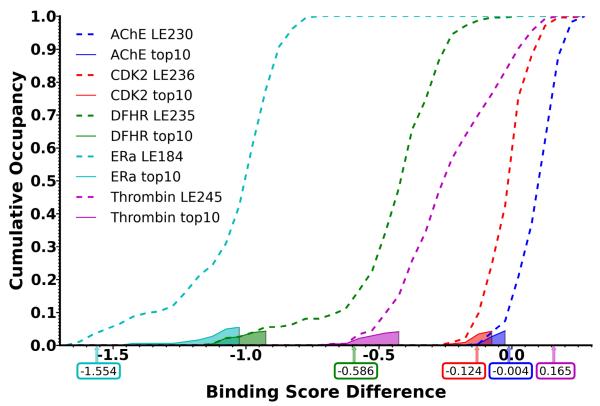
Figure 6.
Cumulative distribution of protein structures as a function of the difference between and . Distributions of all structures of a Limoc ensemble are displayed as dashed lines, the corresponding subpopulations of ten structures selected by training on subsets of actives are displayed as solid lines with transparent fillings. The difference between and for docking to a single apo or holo structure is displayed as vertical arrows below the x-axis including exact values.

