
Figure 7.
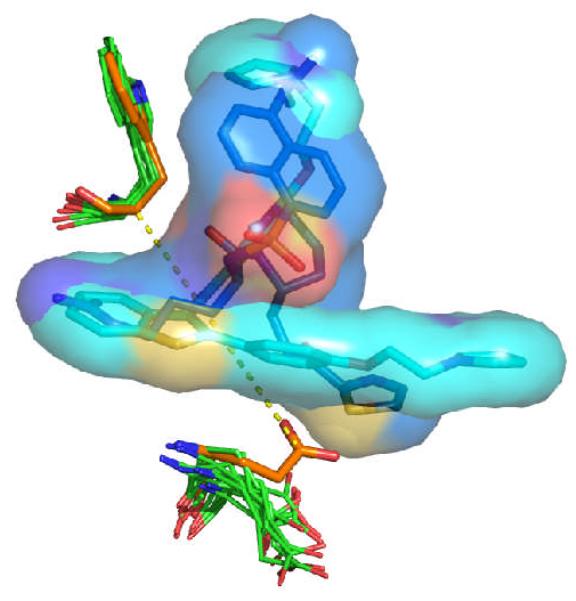
Comparison of the conformations of Glu192 and Trp215 in the apo structure of thrombin (carbon atoms colored in orange) and in the ten structures chosen from the Limoc ensemble with the largest deviation between average scores of actives and decoys (carbon atoms in green). Two representative thrombin ligands in their native binding pose from the PDB databank (1a4w, 1d3t) are displayed with carbon atoms colored in light and dark blue, respectively. Glu192 in the apo structure sterically overlaps with the two ligands. The distance between Cδ of Glu192 and Cα of Trp215 in the apo form of thrombin is shown as yellow dashed line.