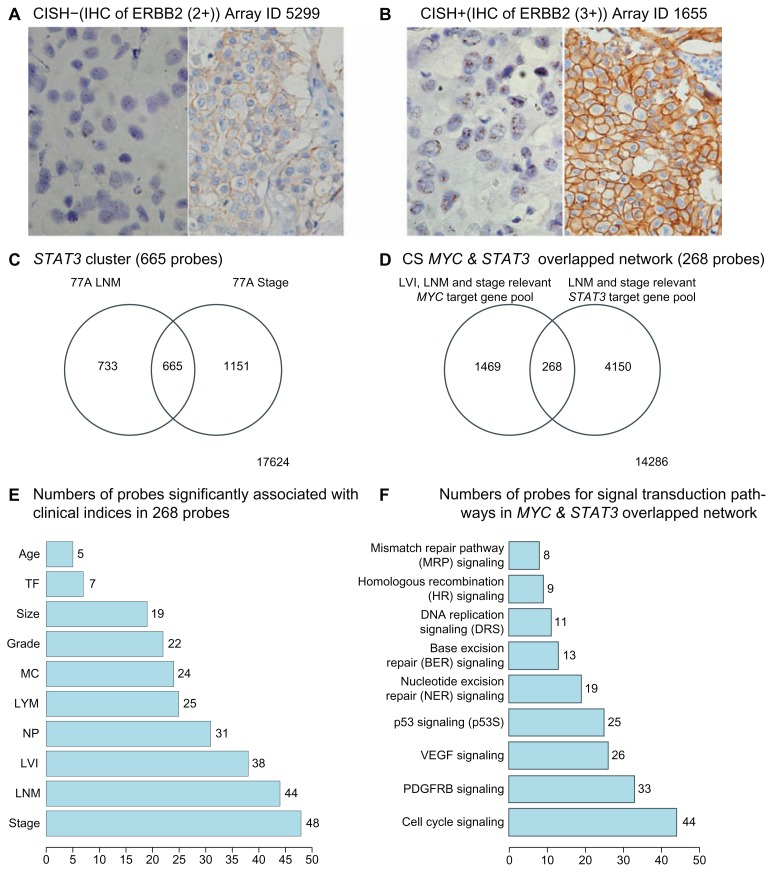
Figure 4.
Examples of ERBB2 status determined by results of both CISH (left side picture) and IHC (right side picture) in (A) and (B). Two Venn Diagrams represent the key results from hunting for the main components of STAT3 network. (C) is for gene pools significantly associated with 2 clinical indices (including STAT3, MYC, and ARNT) that include their non- and overlapped genes. (D) is for target gene pools of both MYC and STAT3 networks that are also clinically significant (CS) including their non- and overlapped genes. (E) is a bar chart of probe number within 268 probes to be overlapped with probes in ten clinicopathological parameters, respectively. (F) is a bar chart of probe number within 6,606 probes, which are in MYC and STAT3 overlapped network, for their probes overlapped with probes in nine assigned signal transduction pathways, respectively.

