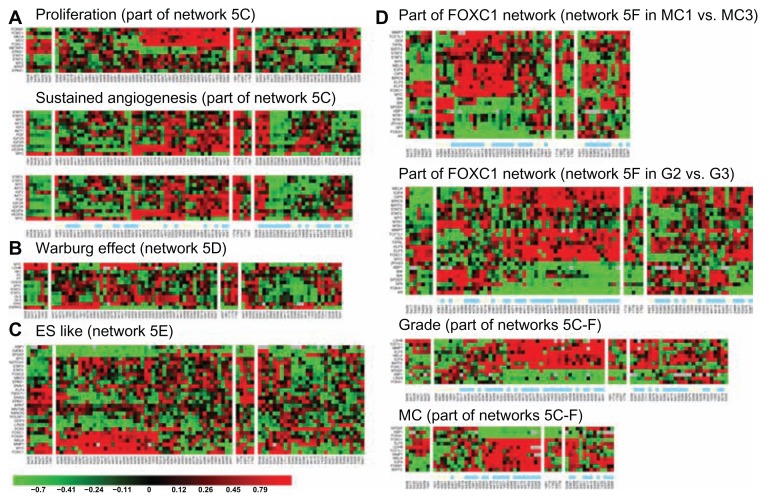
Figure 6.
Heatmaps for subnetworks of MYC & STAT3 differentially coupling with ARNT, FOXM1 in different clinical indices and subtypes of breast cancer. Non-tumor part (NT) serves as a control. Unsupervised gene expression patterns were clustered for subnetworks of three altered biological events (A, B, and C). Networks of MYC & STAT3 in coupling with other transcription factors as well as a FOXC1 subnetwork are observed to functionally promote grade development (D) and sustained angiogenesis (A). The color bar underneath of the heatmap shows beige color for earlier pathological status and light blue color for later pathological status of each denoted clinical index. For instance, at right panel of Figure 6 shows heatmaps for part of FOXC1 network, subnetworks in Figs. 5C–F. At lower panel of Figure 6A, the color bar underneath the heatmaps indicates patients with differential activities of sustained angiogenesis to be not related to their LNM status.
Notes: “G2”, “G3” stand for histological grade 2, 3, respectively. “MC1”, “MC3” stand for mitotic count 1, 3, respectively.

