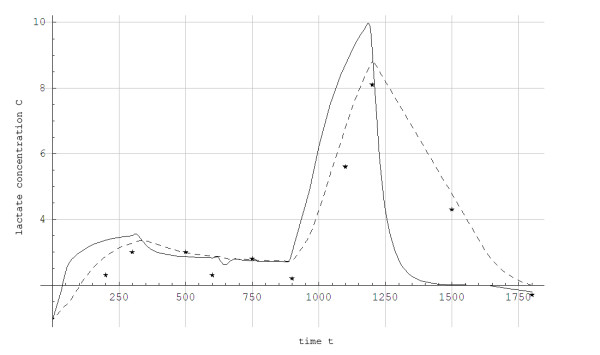
Figure 7.
Simulated blood and muscle lactate concentrations (C) in mmol/L as a function of time (t) in seconds for a skier while treadmill roller skiing in the skating G3 technique at the velocities and inclines shown in Figure 2 and a subsequent recovery period at 0.05 incline at 2.2 m/s. *: Experimental data, ___: Muscle compartment simulation, -------: Blood compartment simulation.

