Figure 3.
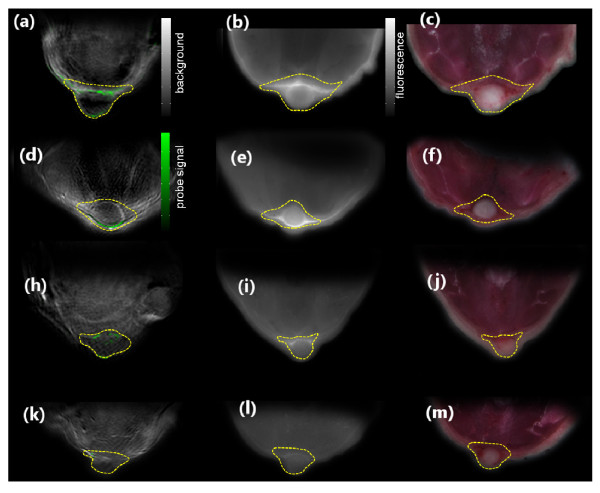
Imaging of targeted apoptotic marker (PSS-794) in 4 T1 tumor-bearing mice. In the first column, the MSOT images are shown. Images (a) and (d) show superposition of a single-wavelength (anatomical) optoacoustic image (in gray scale) and the unmixed component corresponding to the PSS-794 signal in color for the two mice imaged 24 h after injection. (h) shows the unmixed PSS-794 signal for the mouse imaged 3 h post injection, and (k) the ICG signal also imaged 3 h post injection. The second column shows the corresponding epi-fluorescence images of cryo-slices through the tumor. Color photograph of cryo-slices are shown in the third column. The tumor area is delineated in yellow.

