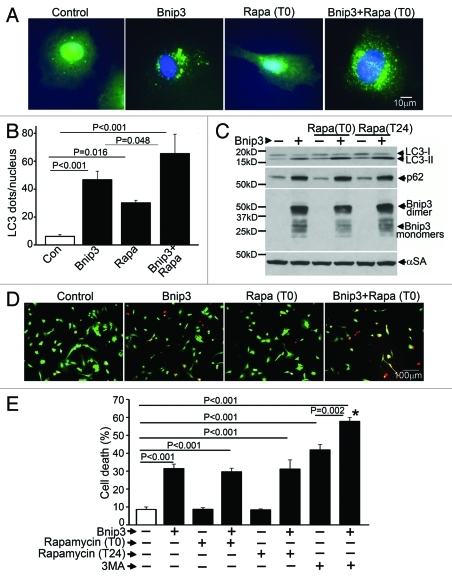
Figure 1. Rapamycin treatment does not protect against BNIP3-induced cell death. (A) Representative epifluorescence images (630× magnification) demonstrating cellular localization of GFP-LC3 in NRCMs adenovirally transduced with BNIP3 or LacZ (as control) for 48 h, and treated with rapamycin (100 nmol/L) at T (time) = 0 (simultaneously at transduction). Nuclei are blue (DAPI). (B) Quantitation of punctate GFP-LC3 dots in cells from (A) (n = 25–40 nuclei/group). p values are by post-hoc test. (C) Immunoblot demonstrating LC3, p62 and BNIP3 (FLAG) expression in NRCMs adenovirally transduced with BNIP3 or LacZ (Con) for 48 h, and treated with rapamycin (100 nmol/L) at T (time) = 0 or 24 h after transduction. Expression of α-sarcomeric actin (αSA) was assessed as loading control. (D) Representative images (200× magnification) demonstrating live (green) and dead (red) cells treated as in (A). (E) Cell death in NRCMs adenovirally transduced with BNIP3 or LacZ (as control) for 48 h, and treated with rapamycin (100 nmol/L) at T(time) = 0 or 24 h after transduction; or 3 methyl-adenine (7 mmol/L) at t = 24 h. n = 8/group. *p < 0.001 vs Bnip3-expressing cells. All p values are by post-hoc test.

An official website of the United States government
Here's how you know
Official websites use .gov
A
.gov website belongs to an official
government organization in the United States.
Secure .gov websites use HTTPS
A lock (
) or https:// means you've safely
connected to the .gov website. Share sensitive
information only on official, secure websites.
