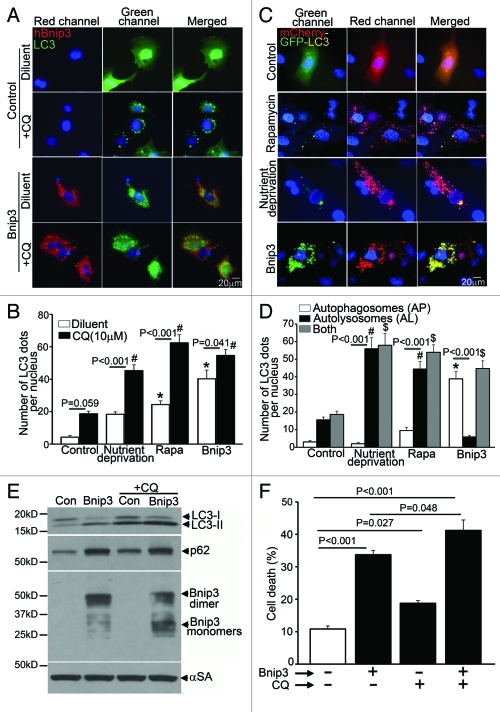
Figure 2. BNIP3 induces autophagosome accumulation in NRCMs. (A) Representative epifluorescence images (630× magnification) demonstrating cellular localization of GFP-LC3 in NRCMs adenovirally transduced with BNIP3 (Red; for FLAG) or LacZ (as control) for 48 h, and treated with chloroquine (10 μM, black bars) or diluent (white bars) for 24 h prior to fixation. Nuclei are blue (DAPI). (B) Quantification of punctate GFP-LC3 dots in cells treated as in (A). and in cells subjected to nutrient deprivation or treated with rapamycin (100 nM) for 4 h in the presence of chloroquine (10 μM, black bars) or diluent (white bars). p values are by post-hoc test. *p < 0.05 vs. diluent-treated control group. #p < 0.05 vs. CQ-treated control group (n = 15–25 nuclei/group). (C) Representative epifluorescence images (630× magnification) demonstrating cellular localization of mCherry-GFP-LC3 in NRCMs adenovirally transduced with Bnip3 or LacZ (as control) for 48 h; subjected to nutrient deprivation or treated with rapamycin (100 nM) for 4 h. (D) Quantitation of autophagosomes (green+red; white bars), autolysosomes (red, black bars) and both (gray bars) in NRCMs treated as in (C) (n = 20–40 nuclei/group). p values are by post-hoc test. *p < 0.05 for autophagosomes vs. control; #p < 0.05 for autolysosomes vs. control and $p < 0.05 for both vs. control (n = 15–25 nuclei/group). (E) Immunoblot demonstrating LC3, p62 and BNIP3 (FLAG) expression in NRCMs adenovirally transduced with BNIP3 or LacZ (Con) for 48 h and treated with chloroquine (10 μmol/L) or diluent for 24 h. Expression of α-sarcomeric actin (αSA) was assessed as loading control. (F) Cell death in NRCMs treated as in E (n = 8–24/group).

An official website of the United States government
Here's how you know
Official websites use .gov
A
.gov website belongs to an official
government organization in the United States.
Secure .gov websites use HTTPS
A lock (
) or https:// means you've safely
connected to the .gov website. Share sensitive
information only on official, secure websites.
