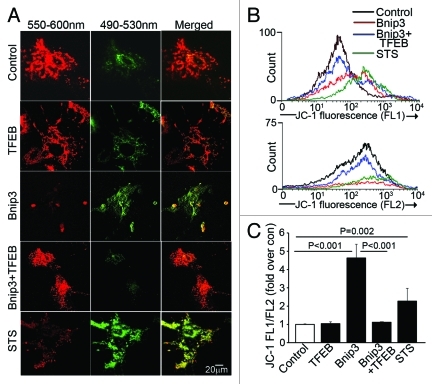
Figure 7. Forced expression of TFEB accelerates clearance of BNIP3-permeabilized mitochondria. (A) Representative confocal images of NRCMs adnovirally transduced with BNIP3, TFEB, BNIP3+TFEB (each at MOI = 100); and LacZ control (added to make total MOI = 200 in each group) for 48 h, demonstrating expression of JC-1 mitochondrial stain. Emission wavelengths employed for imaging the red and green fluorescence are depicted. Staurosporine (STS; 5 μmol/L for 2 h) was added as positive control. (B) Flow cytometric analysis of JC-1 expression with representative traces demonstrating green fluorescence (FL1 channel, B, top) and red fluorescence (FL2 channel, B, bottom). Control is depicted in black, BNIP3 in red, BNIP3+TFEB in blue and staurosporine in green. (C) Quantitation of ratio or FL1/FL2 fluorescence of JC-1 expression in NRCMs treated as in (A). p values depicted are by post-hoc test after one-way ANOVA (n = 3–6/group).

An official website of the United States government
Here's how you know
Official websites use .gov
A
.gov website belongs to an official
government organization in the United States.
Secure .gov websites use HTTPS
A lock (
) or https:// means you've safely
connected to the .gov website. Share sensitive
information only on official, secure websites.
