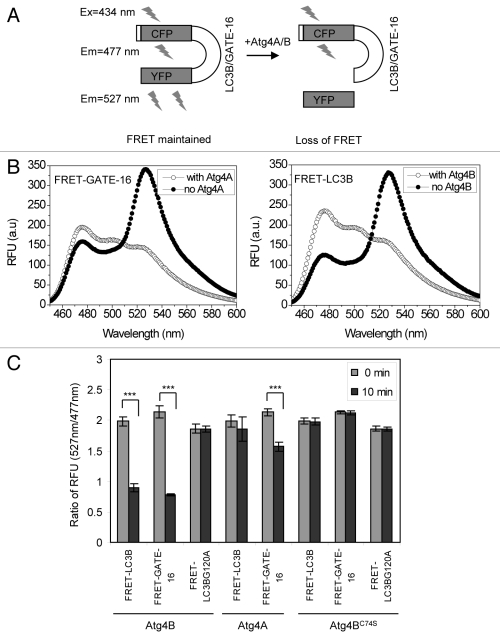
Figure 2. Verification of the cleavage of FRET substrate by Atg4 using the FRET-based assay. (A) Schematic representation of the assay principle. The FRET signal (λem = 527 nm) is reduced as the result of cleavage, which separates the CFP (donor) moiety from the YFP (acceptor) moiety. (B) The fluorescence emission spectra of FRET-GATE-16 or FRET-LC3B before and after cleavage. Substrate (500 μg/ml) were mixed with buffer, Atg4A (100 μg/ml) or Atg4B (2 μg/ml) in a cuvette in the volume of 0.5 ml for 30 min. Data from representative experiments were collected on a Cary Eclipse spectrophotometer. The excitation wavelength was 434 nm. Emission peaked at 477 nm with Atg4 present, but at 527 nm with no Atg4 present in the reactions. In the presence of the corresponding Atg4 enzyme, the ratio of 527 nm/477 nm for FRET-GATE-16 decreased from 1.8 to 0.6 and that for FRET-LC3B was reduced from 1.65 to 0.69. (C) FRET-LC3B, FRET-GATE-16 and FRET-LC3BG120A (100 μg/ml) were incubated with Atg4A, Atg4B, or Atg4BC74S (2 μg/ml) in a volume of 200 μl for 10 min. The fluorescence ratios of 527 nm/477 nm at the beginning and at the 10 min point were determined. Data represent the mean ± SD from three independent experiments. ***p < 0.001 (paired t-test, panel C).

An official website of the United States government
Here's how you know
Official websites use .gov
A
.gov website belongs to an official
government organization in the United States.
Secure .gov websites use HTTPS
A lock (
) or https:// means you've safely
connected to the .gov website. Share sensitive
information only on official, secure websites.
