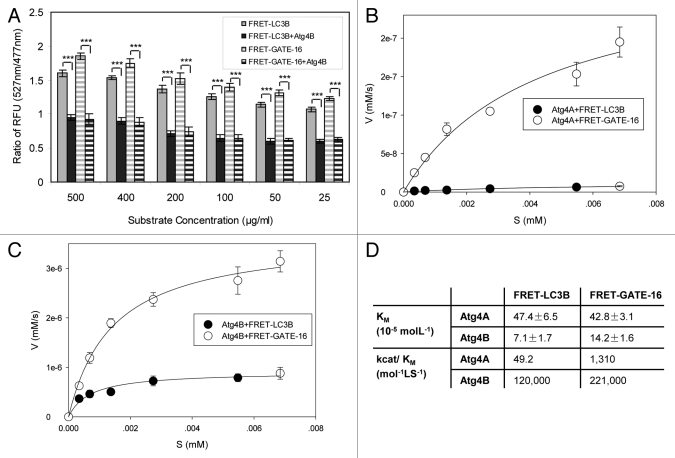
Figure 3. Determination of the kinetics of Atg4A and Atg4B using the FRET-based assay. (A–C) FRET-LC3B and FRET-GATE-16 at different concentrations (25 μg/ml to 500 μg/ml) were incubated with Atg4B (2 μg/ml in A, 0.5 μg/ml in B) or Atg4A (2.5 μg/ml, C) for 30 min at 37°C. The RFUs at 527 nm and 477 nm were determined and the ratios were calculated (A). The initial velocity (V, y-axis) at each substrate concentration was defined as the increment of the substrate per second ([mM]/s), and was calculated based on RFU at the 5 min time point of the reaction for Atg4B (B) or at the 30 min time point of the reaction for Atg4A (C) The velocity was then plotted against the concentration of the substrate (S [mM], x-axis). The curves were fitted using the ligand-binding method (SigmaPlot 10.0). (D). The kinetic parameters KM and kcat/KM were derived from the fitted curves. Data represent the mean ± SD from three independent experiments. ***p < 0.001 (paired t-test, A).

An official website of the United States government
Here's how you know
Official websites use .gov
A
.gov website belongs to an official
government organization in the United States.
Secure .gov websites use HTTPS
A lock (
) or https:// means you've safely
connected to the .gov website. Share sensitive
information only on official, secure websites.
