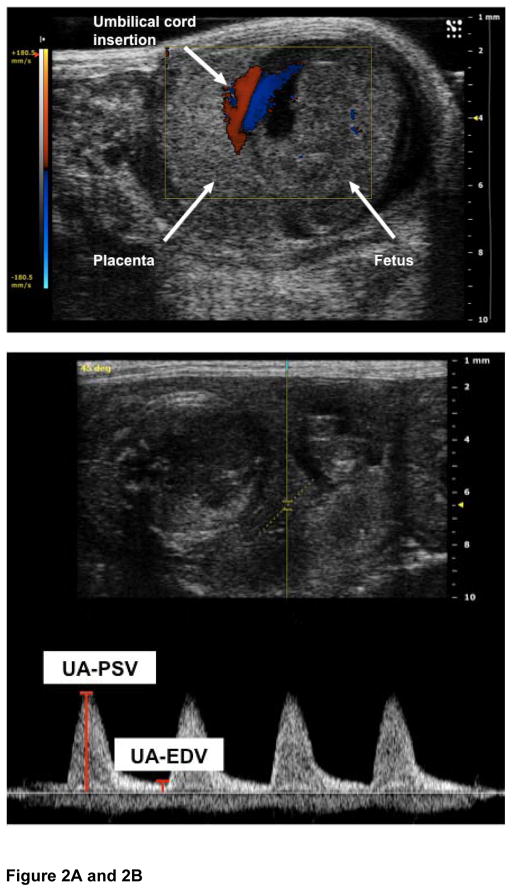
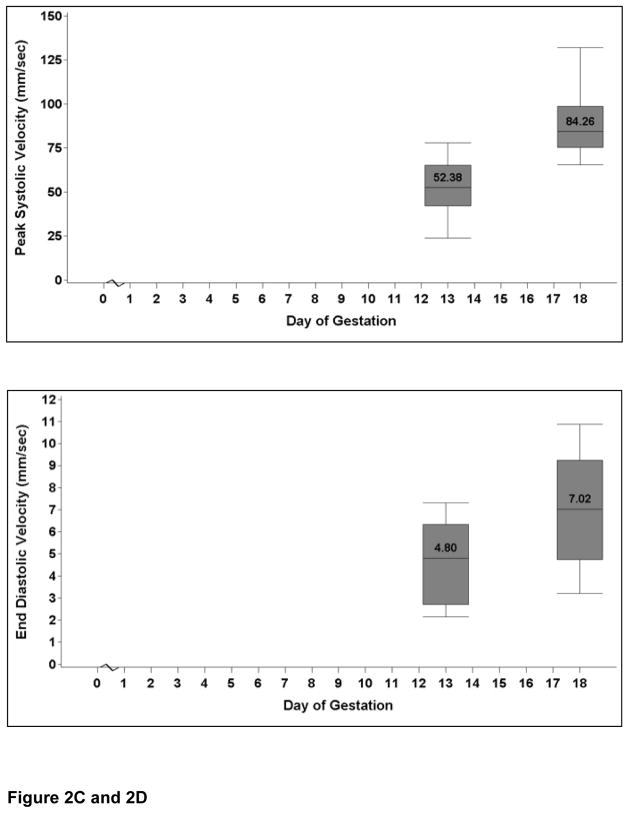
Figure 2. Umbilical artery Dopplers.
Figure 2A: The image shows a pregnant mouse on E13. The placenta is visualized as a homogenous mass. The umbilical cord insertion into the placenta is clearly demarcated by use of color Doppler.
Figure 2B: The placental cord insertion was first identified by color Doppler. A waveform was obtained showing the peak systolic velocity (PSV) and end diastolic velocity (EDV). All analysis was done off line. Umbilical vein tracing is also seen.
Figure 2C: The graph shows the change in the umbilical artery peak systolic velocity at E13 and E18. The values are medians, and the whiskers extend to the 10th and 90th percentiles. There is an increase in peak systolic velocity with advancing gestational age (P<0.001).
Figure 2D: The graph shows the change in the umbilical artery end diastolic velocity at E13 and E18. The values are medians, and the whiskers extend to the 10th and 90th percentiles. There is an increase in end diastolic velocity with advancing gestational age (P=0.015).


