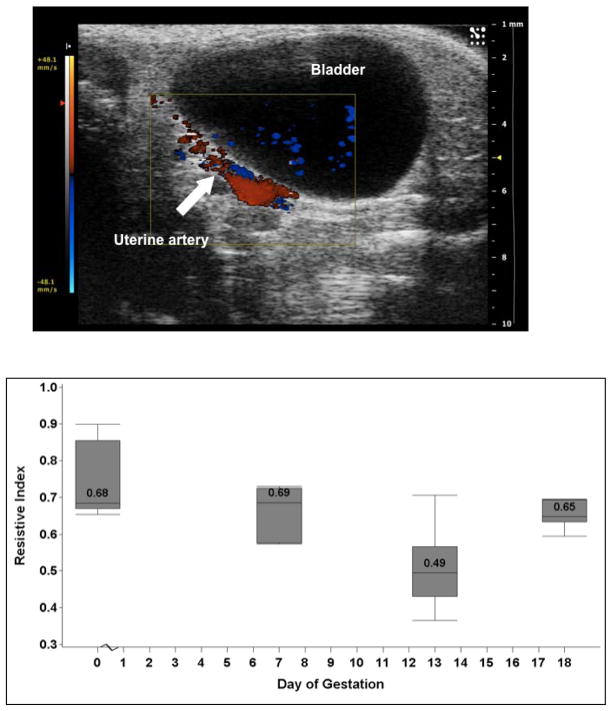
Figure 3. Uterine artery Dopplers.
Figure 3A: The uterine artery was localized using color Doppler behind the bladder. A waveform was obtained using pulse Doppler and the systolic and diastolic velocities were measured.
Figure 3B: The image shows the uterine artery resistance index in non-pregnant and pregnant mice. The values are medians, and the whiskers extend to the 10th and 90th percentiles. The resistance index is lowest at mid pregnancy, but does not differ throughout gestation (P=0.11).

