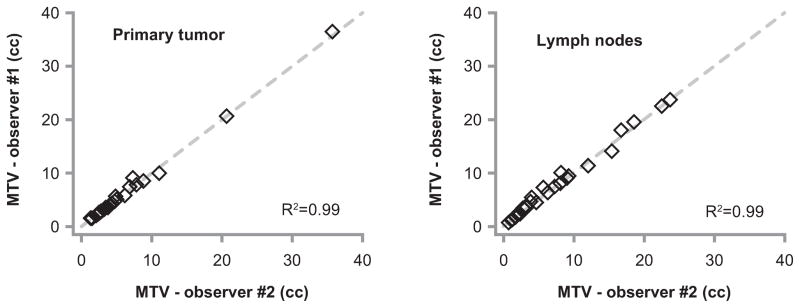
Figure 2. MTV inter-user reproducibility.
Plots represent the results of two blinded observers who independently determined MTV of the primary tumor (left), and lymph nodes (right) on a subset of 30 randomly selected PET-CT scans. Clear diamonds represent individual patients, and the dashed gray line represents a perfect correlation. R2 represents the Pearson correlation coefficient. Abbreviations: MTV = metabolic tumor volume.

