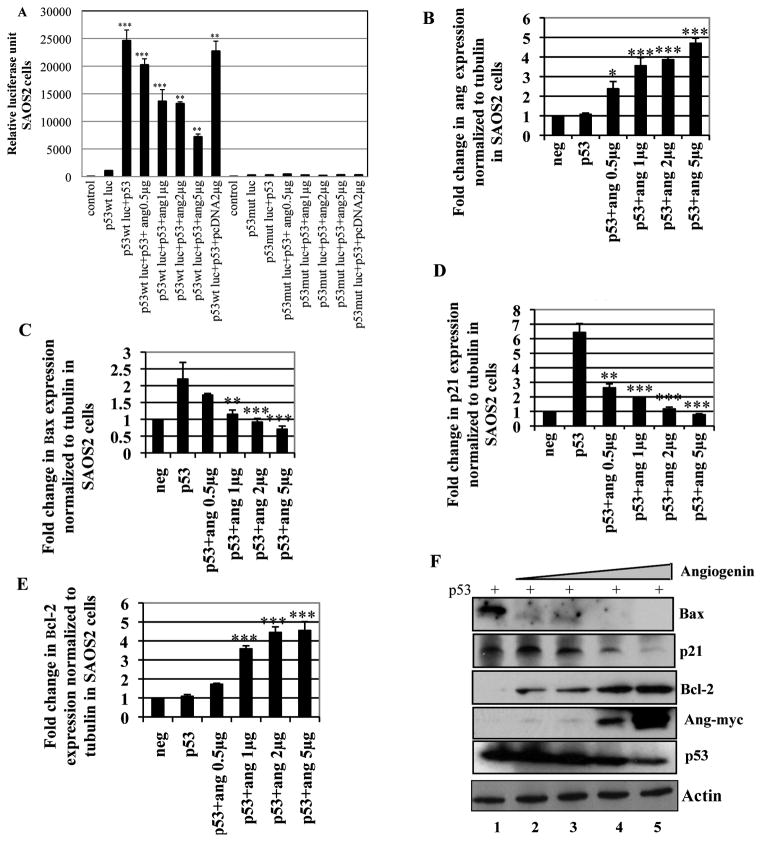
Figure 5. Effect of increased angiogenin expression over p53-luc activity, p53 target gene expression and Bcl-2 expression in SAOS2 cells.
(A) SAOS2 cells were transfected with p53 wt-luc or p53 mut-luc promoters along with p53 flag in the presence of increasing concentrations of angiogenin (0.5–5μg) and the luciferase activity was measured by ELISA. Values are represented as mean ± SD of three independent experiments. (**) p<0.001, (***) p<0.0001 compared with the control. (B–E) cDNA prepared from SAOS2 cells transfected with p53-flag with or without increasing concentrations of angiogenin (0.5–5μg) was used to measure angiogenin expression (B) and p53 target gene expression Bax (C), p21 (D) and Bcl-2 (E) by quantitative real-time PCR. Untransfected cells were used as negative control (neg). For all the above, each reaction was done in triplicate and each bar represents the mean ± SD from three independent experiments. (*) p<0.01, (**) p<0.001, (***) p<0.0001. (F) Western blot analysis showing p53 target gene (Bax, p21, and Bcl-2) expression in SAOS2 cells transfected with p53-flag along with increasing concentrations of angiogenin (0.5–5μg Ang-myc plasmid). Western blots with myc and p53 antibody show the expression of angiogenin (Ang-myc) and p53, respectively. Actin was used as loading control.

