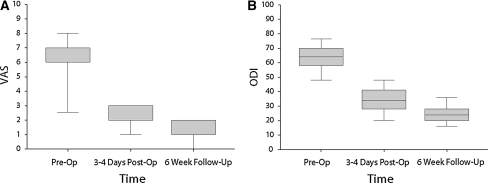
Fig. 4.
Clinical outcomes for surgical treatment with radiofrequency kyphoplasty. The box and whisker plots show the distribution of data for VAS pain and ODI functioning scores. a VAS pain. At pre-op, the median and 75th quartile were both 7. At 3–4 days post-op, the 25th quartile and the median were both 2; the 75th quartile and maximum were both 3. At the 6-week follow-up, the minimum was 0; the 25th quartile and the median were both 1; the 75th quartile and maximum were both 2. The difference in scores between pre-op and 6 weeks was statistically significant (p < 0.001). b ODI functioning. The difference in scores between pre-op and 6 weeks was statistically significant (p < 0.001)

