
Figure 3. Hcy-induced formation of filamentous actin (F-actin) in HIMECs.
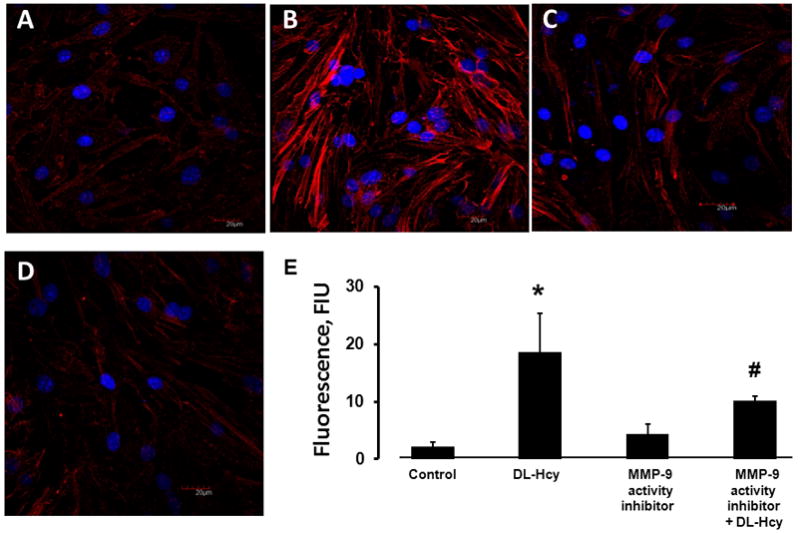
Confluent HIMECs were treated with: A) Medium alone (control); B) 500 μM Hcy (DL-Hcy); C) 5 μM of MMP-9 activity inhibitor alone; (MMP-9 activity inhibitor); and D) 500 μM Hcy in the presence of 5 μM of MMP-9 activity inhibitor (MMP-9 activity inhibitor + DL-Hcy). E) Comparison of fluorescence intensity changes of Alexa Fluor-594 Phalloidin (a measure of F-actin formation) in HIMECs is presented by the histogram.
* P < 0.05 vs. control, # P < 0.05 vs. DL-Hcy. n=4 for all groups.