
Figure 5. Hcy-induced changes in expression of vascular endothelial cadherin (VE-cadherin) in HIMECs.
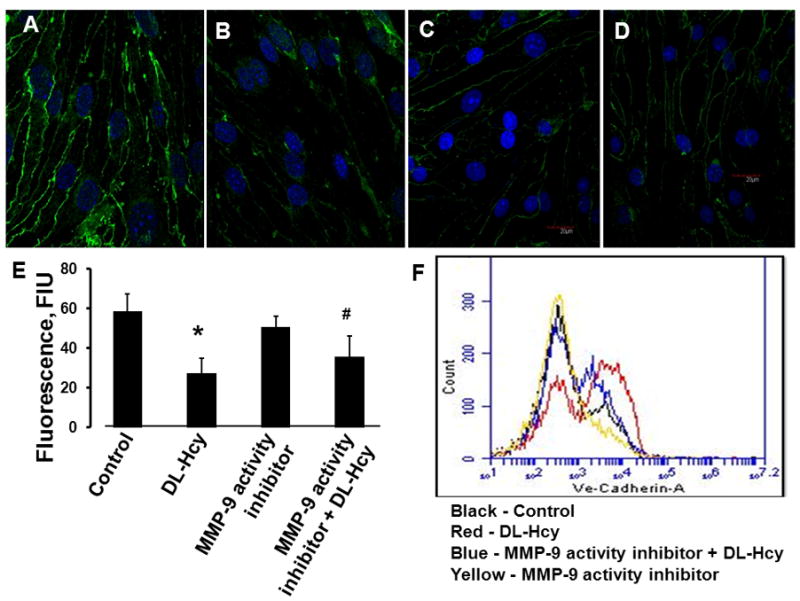
Confocal images show a visible decrease of VE-cadherin expression in HIMECs after treatment with 500 μM Hcy (DL-Hcy) (B), which was enhanced in the presence of 5 μM MMP-9 activity inhibitor (MMP-9 activity inhibitor + DL-Hcy) (D). No difference in VE-cadherin expression was found between cells treated with medium alone (control) (A) and 5 μM of MMP-9 activity inhibitor alone (MMP-9 activity inhibitor) (C). E) Comparison of fluorescence intensity changes (a measure of VE-cadherin expression) in HIMECs is presented by the histogram.
* P < 0.05 vs. control; # P < 0.05 vs. DL-Hcy. n=6 for all groups.
F) Changes in cell surface expression of VE-cadherin on HIMECs measured by flow cytometer confirm results obtained by immunohistochemical analysis and detected by confocal microscopy (see A, B, C, D, and E). Cell number is plotted on the Y axis and fluorescence intensity is plotted on the X axis (log scale). n=6 for all groups.