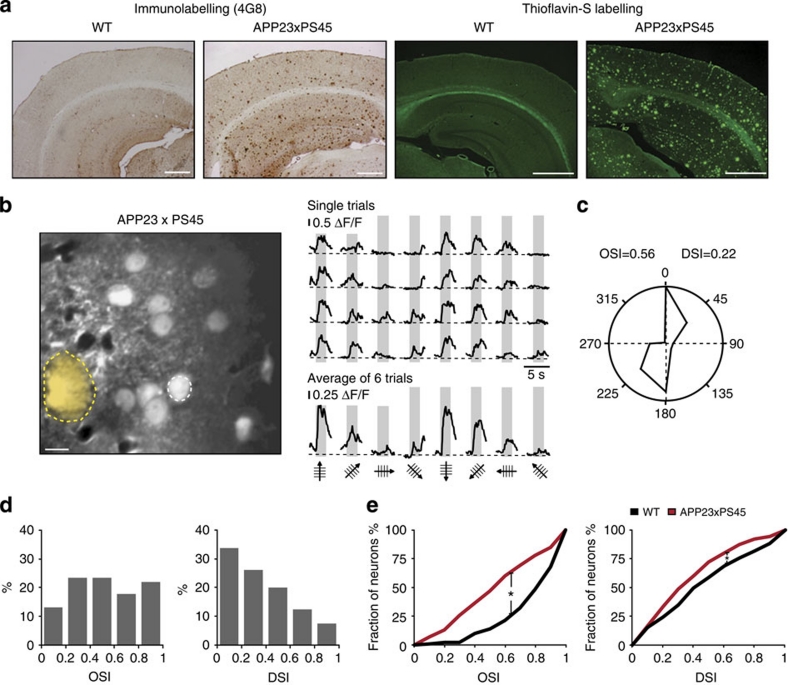
Figure 2. Impaired orientation/direction tuning of visual cortex neurons in 8–10-month-old APP23×PS45 mice.
(a) Amyloid-β-deposition in APP23×PS45 mice. Micrographs of coronal brain slices of visual cortices stained with the 4G8 antibody (a) and Thioflavin-S (b). The slices were obtained from a wild-type (WT, left panels) and an APP23×PS45 mouse (right panels) of the same age (9-months). Scale bars, 500 μm. (b) Left panel, in vivo two-photon image of layer 2/3 neurons in the visual cortex of an APP23×PS45 mouse (8-months). The broken yellow line delineates a Thioflavin-S-positive plaque observed in the imaged focal plane. Right panel, stimulus-evoked calcium transients recorded from the neuron indicated by a white-dotted circle in the left panel. Grey regions indicate periods of visual stimulation with drifting gratings schematized by oriented arrows on the bottom of each panel. Single trials are represented on top and, the average of six trials is shown below. Scale bar, 10 μm. (c) Polar plot showing the neuron's response function to oriented drifting gratings. The responses to each of the eight directions tested were normalized with respect to the maximal response. Then, the function was constructed by connecting the eight values. (d) Distribution of the orientation (OSI) and direction (DSI) selectivity indices of all responsive neurons (n=145 neurons) recorded in the visual cortices of 15 APP23×PS45 mice. (e) Cumulative distributions of the orientation (OSI) and direction (DSI) selectivity indices determined for all responsive neurons recorded in WT (black) and APP23×PS45 (red) mice. Overall the visual cortex neurons of APP23×PS45 mice have significantly lower orientation and direction selectivities compared with WT ones (Mann–Whitney test, OSI, *P<0.001; DSI, *P<0.05).

