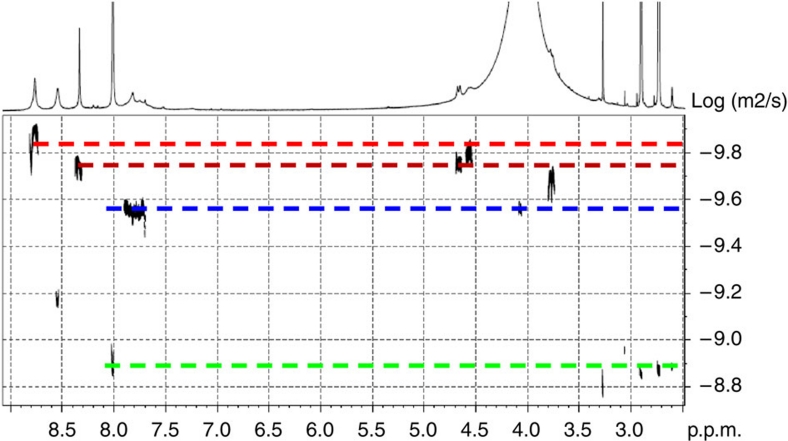
Figure 6. DOSY spectrum of a mixture of cages 1 and 2 in DMF–d7 at 300 K.
Ligands 7 and 8 were at 6 and 12 mM concentration, respectively. DOSY NMR diffusion coefficients, calculated on the basis of monodimensional fitting and expressed in cm2 s−1, are (from top to bottom in the spectrum): cage 2 (1.22 E-06), cage 1 (1.77 E-06), compounds 7 and 8 (3.10 E-06), DMF–d7 ((1.37±0.02) E-05).

