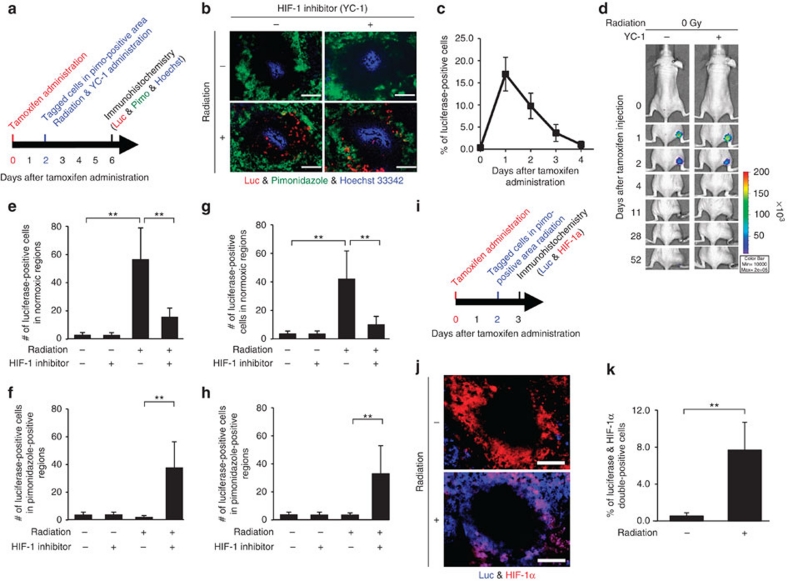
Figure 5. Translocation of radio-surviving tumour cells.
(a) Schematic diagram of treatments in (b). The tumour-bearing mice were treated with 0 (−) or 25 (+) Gy of γ-rays on 2 days after tamoxifen injection. YC-1 was administered to suppress radiation-induced activation of HIF-1 (ref. 30). (b) Immunohistochemistry with anti-luciferase (red) and anti-pimonidazole (green) antibodies of the xenografts 4 days after the irradiation. Blue: Hoechst 33342. Bar, 50 μm. (c) The percentage of luciferase-positive cells on the indicated days was quantified in the unirradiated and DMSO-injected sections in (b). n=40 tumour cords in 12 sections. (d) The tumour-bearing mice were injected with (+) or without (−) YC-1 2 days after tamoxifen administration, and subjected to optical imaging on the indicated days. Representative images of 12 mice are shown. (e) The numbers of luciferase-positive cells in normoxic regions were quantified in the sections of (b). n=40 tumour cords in 12 sections. **P<0.01 (Student's t-test). (f) The numbers of luciferase-positive cells in pimonidazole-positive regions were quantified in the sections of (b). n=40 tumour cords in 12 sections. **P<0.01 (Student's t-test). (g) After transfection with the 5HREp/Cre-ERT2–ODD gene and CAGp/loxP-polyA-loxP-luciferase gene, antibiotic-resistant WiDr cells were selected with blasticidin. Tumour xenografts, with the resultant stable transfectant, were subjected to the same experiment as (a,b). The numbers of luciferase-positive cells in normoxic regions were quantified in the sections. n=40 tumour cords in 12 sections. **P<0.01 (Student's t-test). (h) The numbers of luciferase-positive cells in pimonidazole-positive regions were quantified in the experiment of (g) n=40 tumour cords in 12 sections. **P<0.01 (Student's t-test). (i) Schematic diagram of treatments in (j). The tumour xenografts, with HEK293 transfectant, were subjected to immunohistochemistry 1 day following the 0 (−) or 25 Gy (+) of radiation. (j) Immunohistochemistry with anti-luciferase (blue) and anti-HIF-1α (red) antibodies. Bar, 50 μm. Representative images of 12 xenografts are shown. (k) Percentages of luciferase and HIF-1α double-positive cells were quantified in the sections of (j). n=40 tumour cords in 12 sections. **P<0.01 (Student's t-test).

