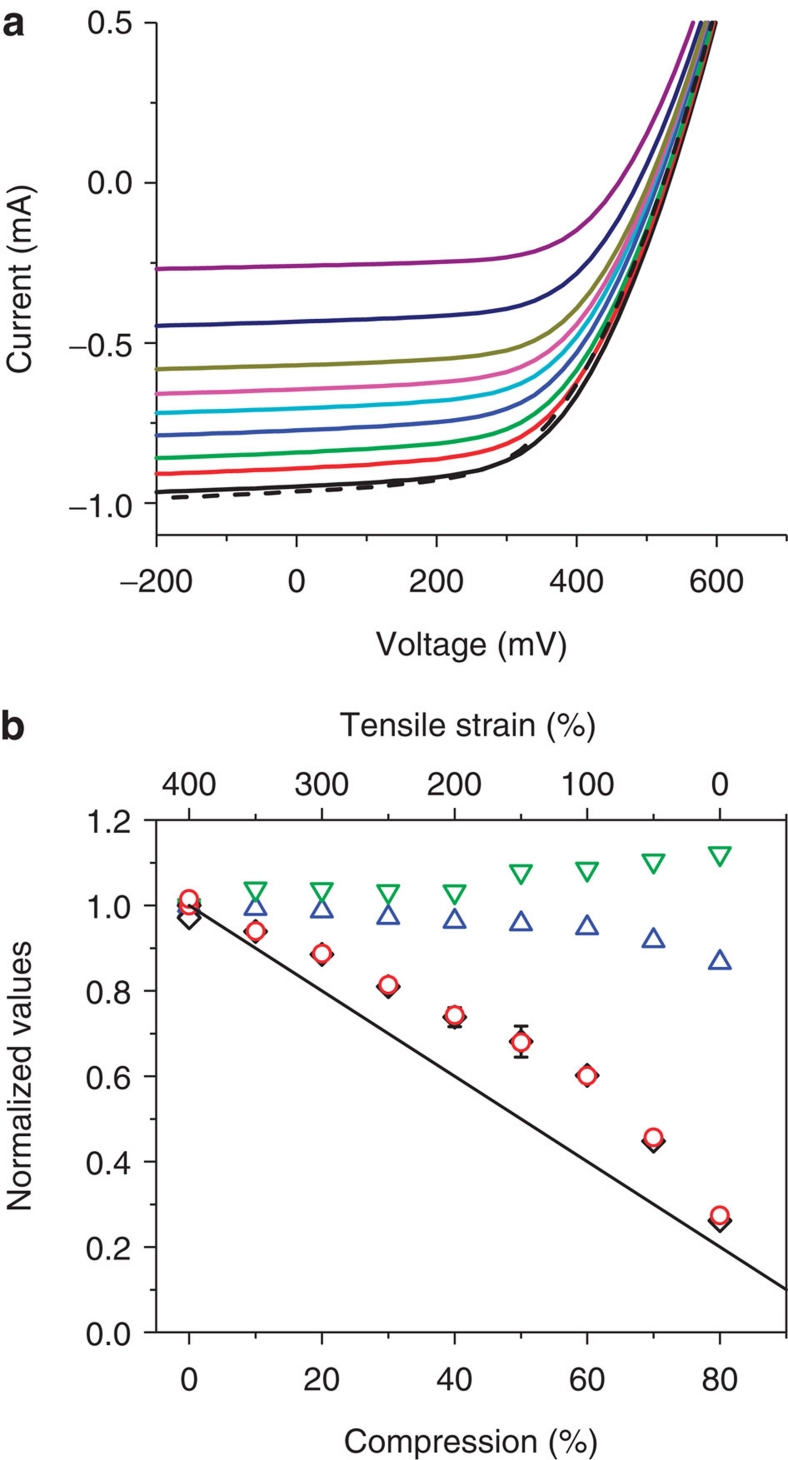
Figure 4. Extreme mechanical deformation.
(a) I-V curves during compression on pre-stretched elastomer. The solid black line represents 0% and the purple line represents 80% compression with the intermediate steps of 10% distributed between accordingly. The dashed black line represents the device after re-stretching from 80% compression to its initial flat state. (b) Measured device parameters 0–80% compression, which correspond to 400–0% tensile strain or five times change in size. Green downward triangles represent FF, blue upward triangles VOC, red circles ISC and black diamonds power. All parameters are normalized to their pre-compression value. The ISC and correspondingly the total maximum power of the solar cell decrease, but maintain higher values than would be expected with the corresponding decrease of device area, represented by the black line. Upon re-stretching the device to its original size, the values are nearly identical to the pre-compression state. The symbol size is chosen to represent the reproducibility of the experiment, as indicated by error bars for selected data points for the power metric.

