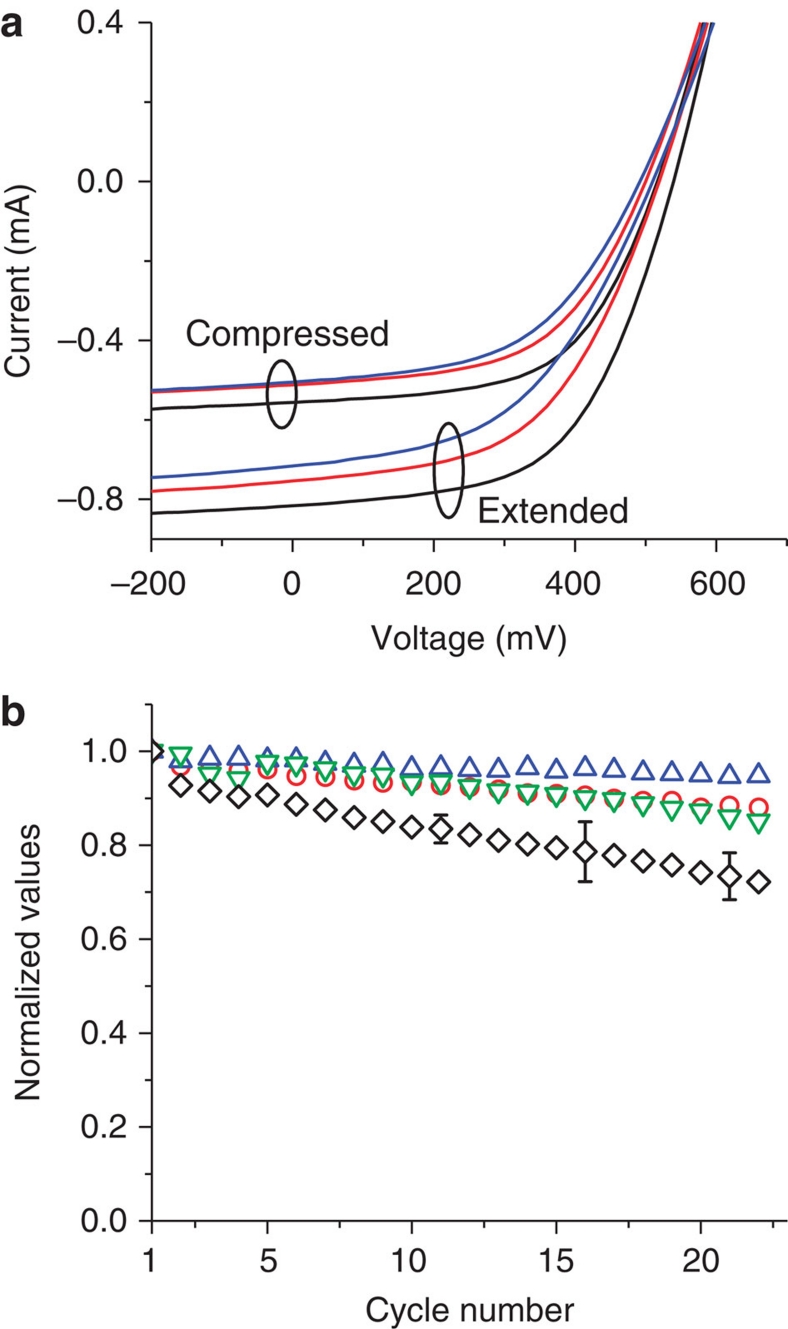
Figure 6. Resilience to cyclic compression–stretching.
Device performance during 22 consecutive compression–stretch cycles to 50% compression. (a) The I-V characteristics are shown at 1 (black), 11 (red) and 22 (blue) cycles for both the fully extended and 50% (quasi-linear) compressed states. (b) Device performance metrics plotted at each of the 22 cycles for the fully extended state. Green downward triangles represent FF, blue upward triangles VOC, red circles ISC and black diamonds power. All parameters are normalized to their initial value. Upon cycling, a reduction of the FF and ISC is observed. The origin of these losses is unknown, but is certainly in part owing to the experimental apparatus and loss of contact. The overall efficiency is shown to be 73% of its original value after 22 repeated cycles. Multiple separate devices were subjected to cyclic testing. For the sake of clarity, error bars are indicated only for the power metric for selected data points, as this is the primary metric for device characterization.

