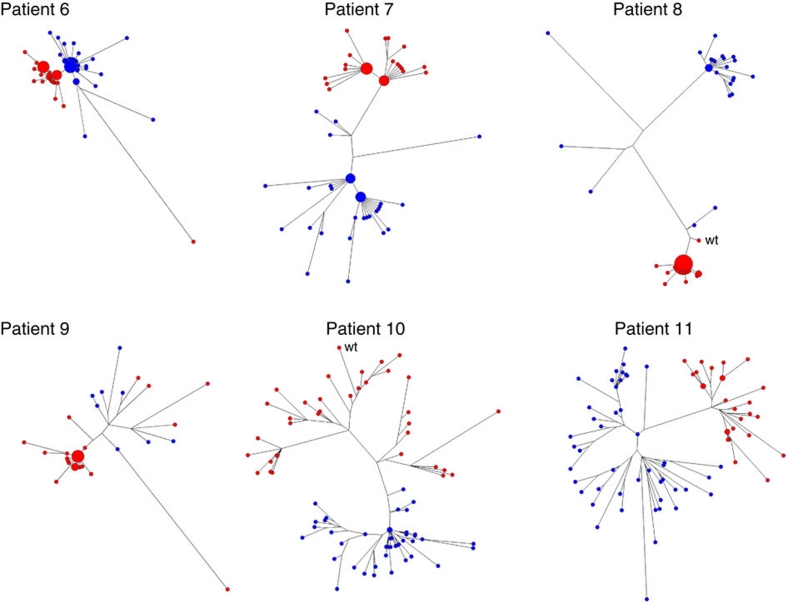
Figure 3. Maximum likelihood trees of intra-host HBV variants sampled before and after lamivudine therapy.
HBV variants were sampled from Patients 6–11 before (blue) and after (red) treatment with lamivudine. The node size is proportional to frequency of the corresponding variant in the viral population. For Patients 8 and 9, only pre-treatment subpopulations that were genetically closest to the resistant variants are shown.

