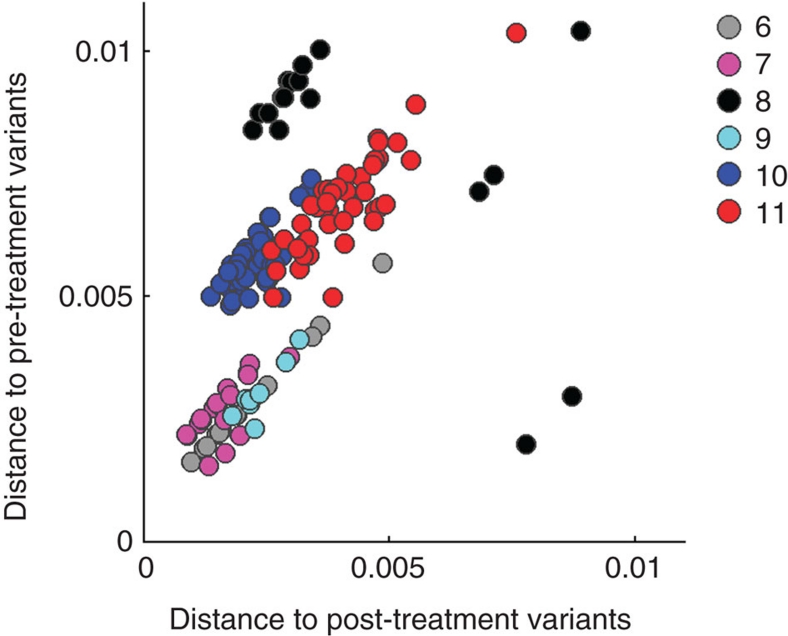
Figure 4. Scatterplot of distances among intra-host HBV variants of six patients.
Genetic distances are shown for Patients 6–11. Each pre-lamivudine sequence was plotted according to its value in two dimensions: the average distance to all other pre-treatment variants (x axis) and the average distance to all other post-treatment variants (y axis).

