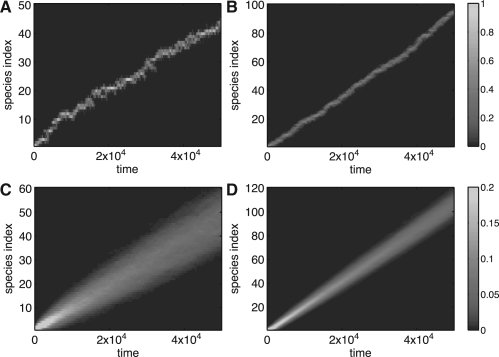
Fig. 1.
Simulations of the linear fitness model with Δt=0.1, ϵ=10−3, η=10−3 and nmin=nmax/10. The instantaneous distributions of the populations over the species index normalized by nmax as a function of time are shown for nmax=104 (A) and nmax=105 (B). Wave-like behavior is evident in both cases, though the smaller population leads to a noisier and slower wave. Panels (C) and (D) show the corresponding probabilities averaged over 800 realizations. The wave velocity, by a least squares linear fit to the ensemble mean fitness, is 0.93×10⁻³ and 2.1×10⁻³ indices per unit time for (C) and (D), respectively.

