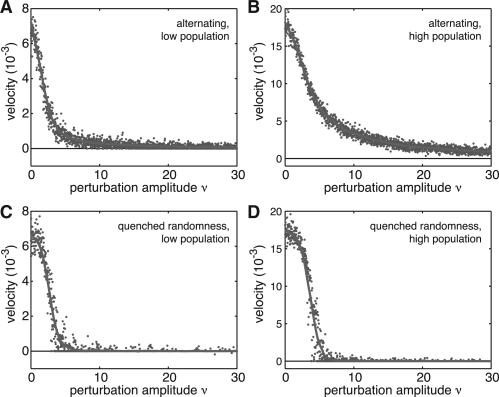
Fig. 3.
Ruggedness of the fitness landscape impacts speed of evolution in a linear fitness model. Shown are apparent wave velocities (blue dots) derived by least-square fitting of the mean index 〈m〉 across species as a function of time. The model with deterministic alternating fitness and nmax=104 (A) or nmax=105 (B) leads to a smooth decay of wave velocity with respect to the perturbation amplitude ν. In contrast, a model with quenched disorder in fitness and nmax=104 (C) or nmax=105 (D) exhibits an abrupt decrease in wave velocity suggesting a phase transition. In all cases, nmin=nmax/10, η=10−3, ϵ=10−2, γm=0.1, and Δt=0.02. The red curve indicates trend lines generated by a Savitzky–Golay filter. (For a colour version of this Figure see Supplementary Data online).

