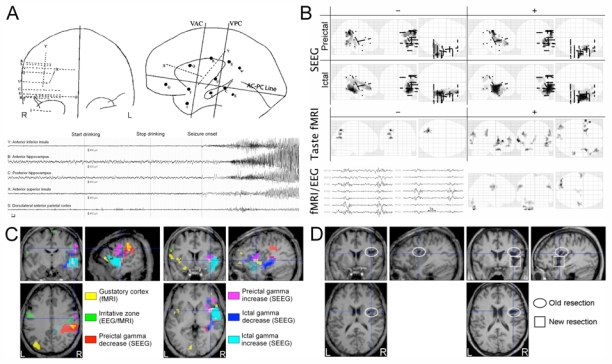
Figure 1.

A) Left: Coronal and lateral representation of the stereotaxic implantation scheme. Right: Reflex seizure showing ictal onset in the right insula and secondary spreading in the hippocampus.
B) SEEG: Maximum intensity projections of changes (decrease: −; increase: +) in gamma power during preictal and early ictal states, as compared to baseline level (two-sample t-test, p<0.05, FWE corrected). The two seizures have been pooled together using a fixed-effect analysis. Black dots indicate electrode positions. Regions showing the strongest effects (in dark) are: dorsolateral parietal cortex (preictal −), hippocampus (ictal −), primary sensorimotor cortex (preictal +), insula (ictal +). Taste fMRI: BOLD activations and deactivations (p<0.005, uncorrected) observed during strawberry syrup intake. Note the activation of the insula bilaterally and of the right frontal dorsolateral cortex. fMRI/EEG: fMRI/EEG showed bilateral BOLD changes (p<0.05, FWE corrected) in the lower part of the primary sensorymotor cortex, which were correlated to bilateral brief paroxystic EEG activity.
C) Overlay of fMRI and SEEG results using the same statistical thresholds as in B). Left: Crosshairs on the dorsolateral fronto-parietal region. Right: Crosshairs on the anterior insula.
D) Left: Preoperative T1 MRI showing the scar of the resection of the cavernoma (ellipse). Right: Postoperative T1 MRI showing limited resection in the middle short gyrus of the insula (square).
