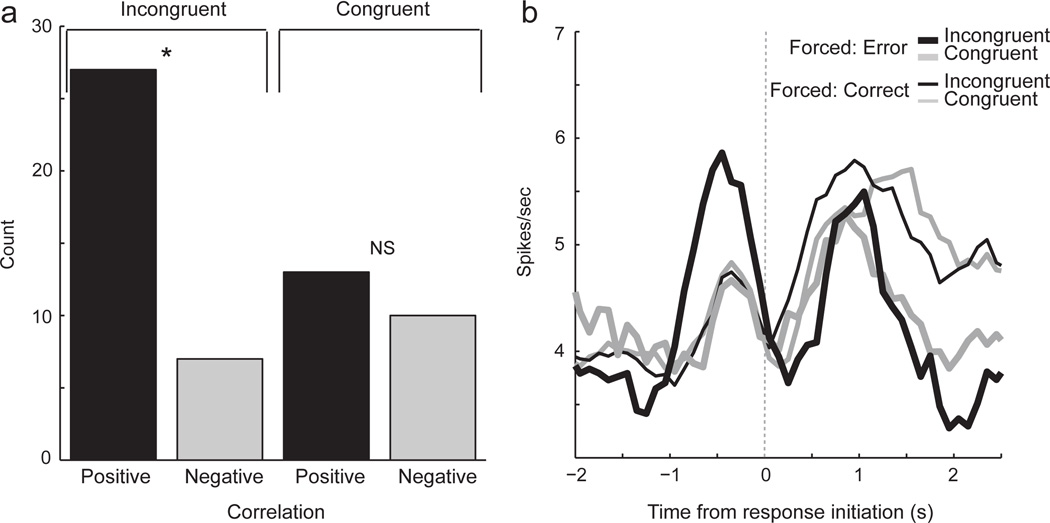
Fig. 4.
Activity was correlated with reaction time. (A) Correlation analysis between firing rate taken 200 ms prior to response initiation and reaction time (port exit minus odor offset). Analysis was performed independently for congruent and incongruent conditions for all ABL neurons. Height of each bar indicates the count of neurons that showed a significant positive or negative correlation between reaction time and firing rate. (B) Curves represent average population firing rate, aligned on odor port exit, for all cells that exhibited a significant positive correlation (n = 27). Activity was significantly higher for incongruent errors (thick black) than for congruent errors (thick gray; ttest; p < 0.05). There were no other differences in firing (p’s > 0.05). Thick black = Incongruent errors; Thick gray = Congruent errors; Thin black = Correct incongruent; Thin gray = Correct congruent.

