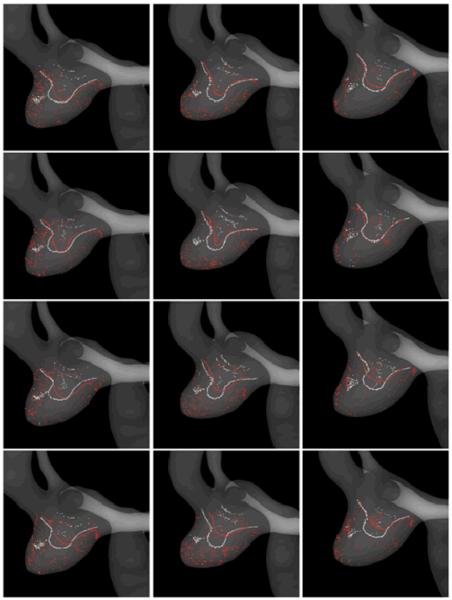
Figure 6.
: Visualizations of the CFD (white) and PIV (red) flow structures using vortex coreline detection algorithms. Columns correspond to the three time points during the aneurysm evolution (models M1, M2 and M3 of Figure 2), while the rows to the four instants of time during the cardiac cycle (time 1, 2, 3 and 4 of Figure 4).

