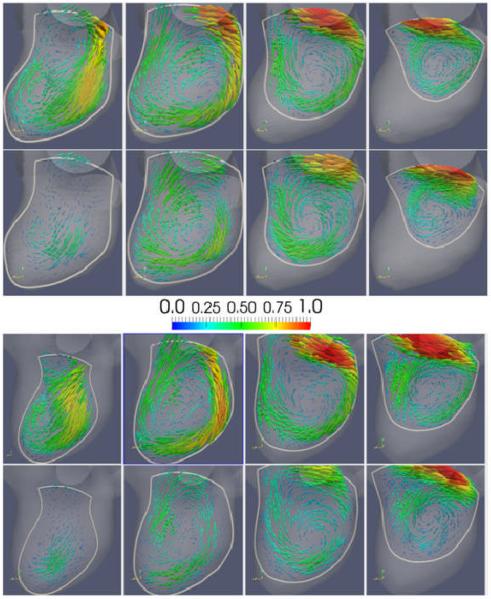
Figure 7.
: Visualizations of CFD and PIV flow fields on four selected cut-planes at peak systole (time 2 of Figure 4). Columns show the four cut-planes (P1, P2, P3 and P4) indicated in Figure 2. Top panel shows model M1 and bottom panel model M3. Top row of each panel shows CFD fields, and bottom row PIV fields.

